New features: Prometheus/Grafana integration; Bluetooth & RF4CE support; interactive log viewer
07 Sep 2021.
2021 has been a busy year for us, with major new features implemented to support specific customers’ requirements: Prometheus and Grafana dashboards for logging and reporting performance measurements and other real-time metrics; support for some Bluetooth and RF4CE remote controls via RedRat-X hardware; an interactive log viewer with frame-accurate synchronisation between each log line and the video recording of the test-run; and a new test-farm administration page.
We have other major new features in the works, but the ones in this article are available now to all our customers.
Prometheus & Grafana integration
Prometheus is an open-source time-series database used for monitoring and alerting. Grafana is an open-source dashboard and visualisation tool that integrates with Prometheus.
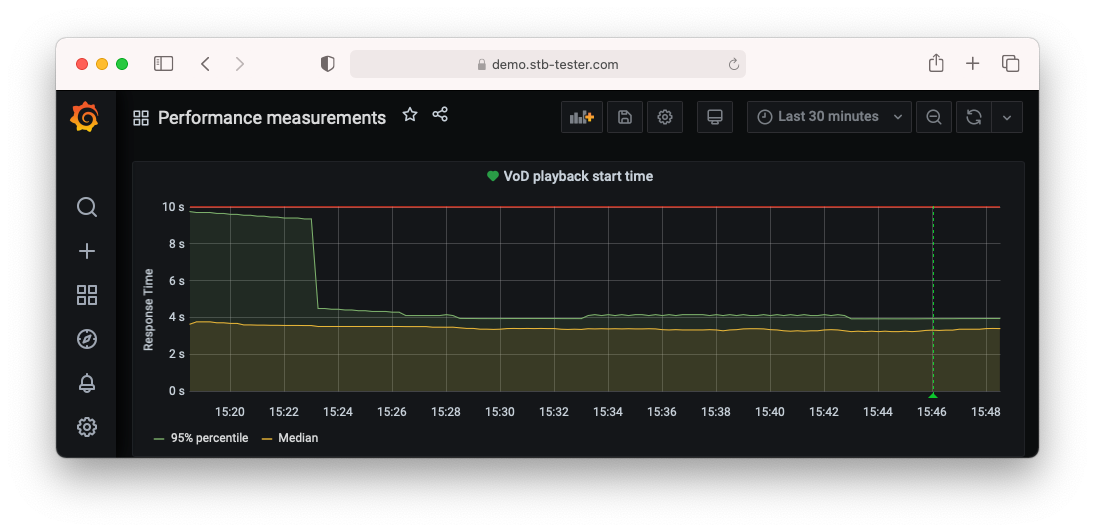
Note the median (yellow), 95th percentile (green), and alarm threshold (red).
Using our new stbt.prometheus APIs, your test-scripts can record measurements for ingestion into a Prometheus database. On your Stb-tester Portal we can host a Prometheus & Grafana instance for you; or you can ingest the data into your own Prometheus instance.
Example use-cases include:
- Counters: The number of times the “buffering” indicator or “loading” spinner has appeared; the number of black frames or glitches seen; the number of tests that failed, or the number of VoD assets that failed to play; etc.
- Gauges: Measuring the temperature or memory usage on your device-under-test.
- Histograms: Performance measurements such as channel-change duration, app launch duration, or time for VoD content to start playing.
Since your tests are written in Python, performance measurements are as simple as calling time.time() before and after the action you want to measure.
Bluetooth & RF4CE remote controls
The Stb-tester press() API now supports RedRat-X hardware, to control the device-under-test via Bluetooth or RF4CE (ZigBee).
RedRat-X hardware must be purchased separately. Contact RedRat to see if your particular remote control is supported. Typically there is a one-off onboarding fee to support new remote controls.
Interactive log viewer
In the Stb-tester Portal’s test-results view, click on the timestamp of any log line to seek the video to that exact time:
This log is anything printed by your test-script — for example using Python’s print() function, or the debug information that is automatically printed when you call Stb-tester APIs.
The timestamp at the left of each line is the time when Python printed the line. Timestamps from a specific frame of video are also clickable — for example Frame.time, MatchResult.time and MotionResult.time in the debug output from various Stb-tester APIs. These frame timestamps come from our HDMI video-capture hardware. If you’re confused by the difference, consider this koan:
frame = stbt.get_frame()
time.sleep(10)
print(f"The frame was captured at: {frame.time}")
The output would be something like this:
![15:19:35.374 The frame was captured at: 1630678765.206 [15:19:25.206]](/blog/images/prometheus/log-line.png)
The log viewer shows timestamps in your local timezone. (In the raw log file, the timestamps are always in UTC.)
We have also added controls to the video player to step forward or backward by 1 frame at a time, or 1 second, or 10 seconds.
Our new log viewer is a very powerful tool for triaging test failures and understanding the behaviour of your device-under-test. It’s also useful for spot-checking performance measurements, to gain confidence in the correctness of your test scripts!
Test-farm administration interface
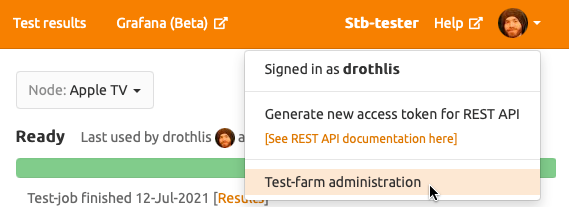
The new Test-farm administration page in the Stb-tester Portal lists all of your Stb-tester Nodes, with their current firmware version and license expiration dates. It allows you to reboot Stb-tester Nodes, force HDMI re-negotiation to simulate hot-plugging the HDMI cable, and install firmware updates.
Access this page from the user drop-down menu in the top right corner of the Stb-tester Portal: