User Interface Reference#
Test farm#
Click on the device name at the top left corner of the screen to access a menu where you can quickly switch between your devices:
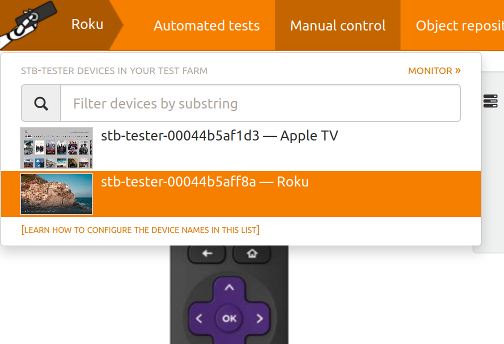
By default this displays the ID of each Stb-tester Node (which is based on its MAC address). You can configure a “friendly name” to display: See node.friendly_name in the Configuration Reference.
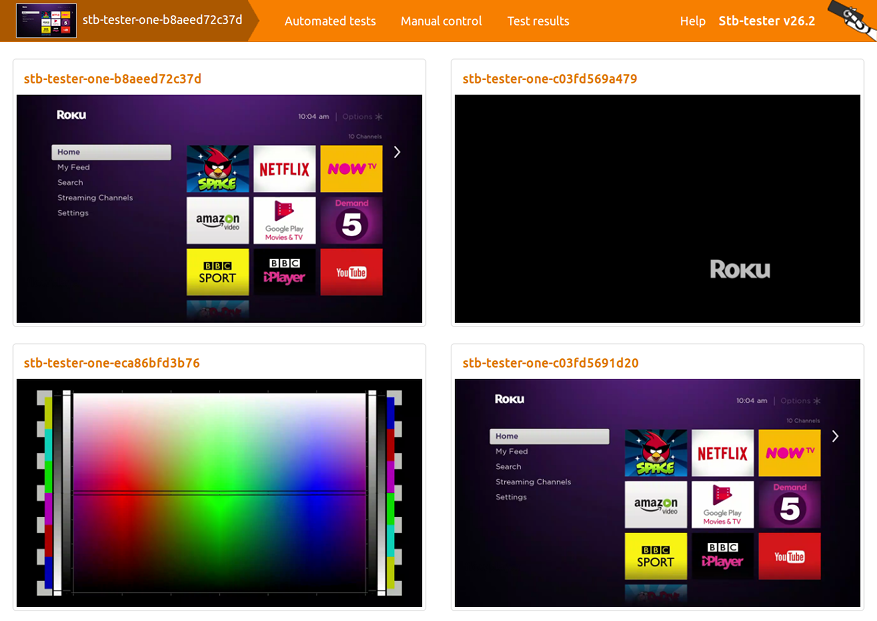
From this menu click “monitor” to access a “video wall” that allows you to monitor all the devices in your test farm:
Live video formats#
The Stb-tester Portal shows live video from the device-under-test, right in your web browser. Click the settings icon underneath the video to choose the format used for streaming the video:

WebRTC video is high quality and low latency, but it may not work if you are on a different network than the Stb-tester Node. JPEG thumbnails are low quality and low framerate, but they will work in any network configuration.
WebRTC |
JPEG thumbnails |
|---|---|
High quality |
Low quality |
Video & audio |
No audio |
Low latency |
1-2 seconds latency |
Full frame-rate |
1 frame per second |
Delivered peer-to-peer (may not work if there is a firewall between you and the Stb-tester Node) |
Delivered via the Stb-tester Portal (so it works in any network configuration) |
40-220 kB/s outbound bandwidth per viewer |
20-35 kB/s (total) if 1 or more viewers |
Admin page#
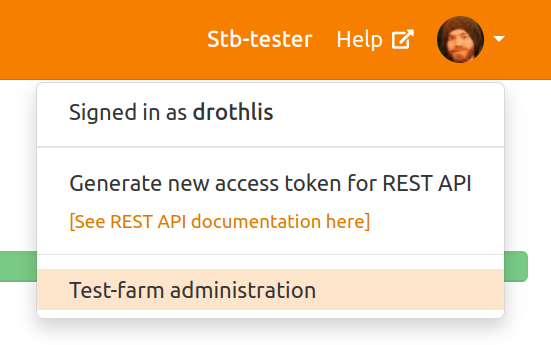
From the “user” drop-down menu at the top right corner, select “Test-farm administration”. From this page you can view and manage your Stb-tester Nodes, users, and encrypted secrets.
Location data#
For the convenience of our customers who have large test-farms spread across the world, we display the approximate geographical location of each Stb-tester Node. This is based on the Node’s IP address, using the GeoLite2 database created by MaxMind.
We don’t send any information (such as IP addresses) to MaxMind; the lookup is done with a local copy of the MaxMind database.
Running tests#
Job category#
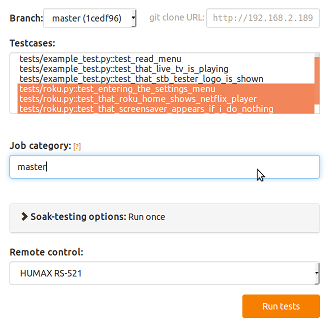
This is simply a way of categorising your test results into different “folders”. When viewing test results, you can filter by this category so that you only see the relevant results.
For example, you might use the system-under-test’s version as the job category. Or if you are testing changes you’ve made to the test scripts, you might use your own name or the name of the git branch, so that your results don’t pollute the “real” results.
Soak-testing options#
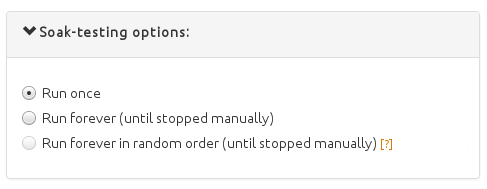
Run once#
Each test selected in the Testcases list will run once in the order in which they are selected in the list. Once all the testcases have been run the test job will finish.
Run forever (until stopped manually)#
The testcases selected in the Testcases list will be run in the order in which they are selected in the list. Once all the testcases have been run the tests will start again from the beginning of the testcase list.
The testcases will continue to be run in a loop until the button
is clicked, or the testcase calls stbt.stop_job.
Run forever in random order (until stopped manually)#
This option runs the given testcases in a random order, until the button is clicked.
This can be useful if you have structured your test-pack as a large number of short targeted tests. You can then select many different tests to attempt a random walk of different journeys though your set-top-box UI. This can be particularly effective at finding hard to trigger bugs and get more value out of the testcases you have written.
Some tests may take much longer than other tests, which will then use up a disproportionate amount of your soaking time. To work around this we measure how long each test takes the first time it runs, and then we use that as a weighting when choosing the next test to run. Overall, we try to spend the same amount of time in each testcase, so we run the shorter testcases more frequently.
This makes it reasonable to include tests that take 10 seconds, and tests that take a few minutes or hours, in the same random soak.
These options correspond to the soak and shuffle parameters of the run_tests REST API.
Manual control#
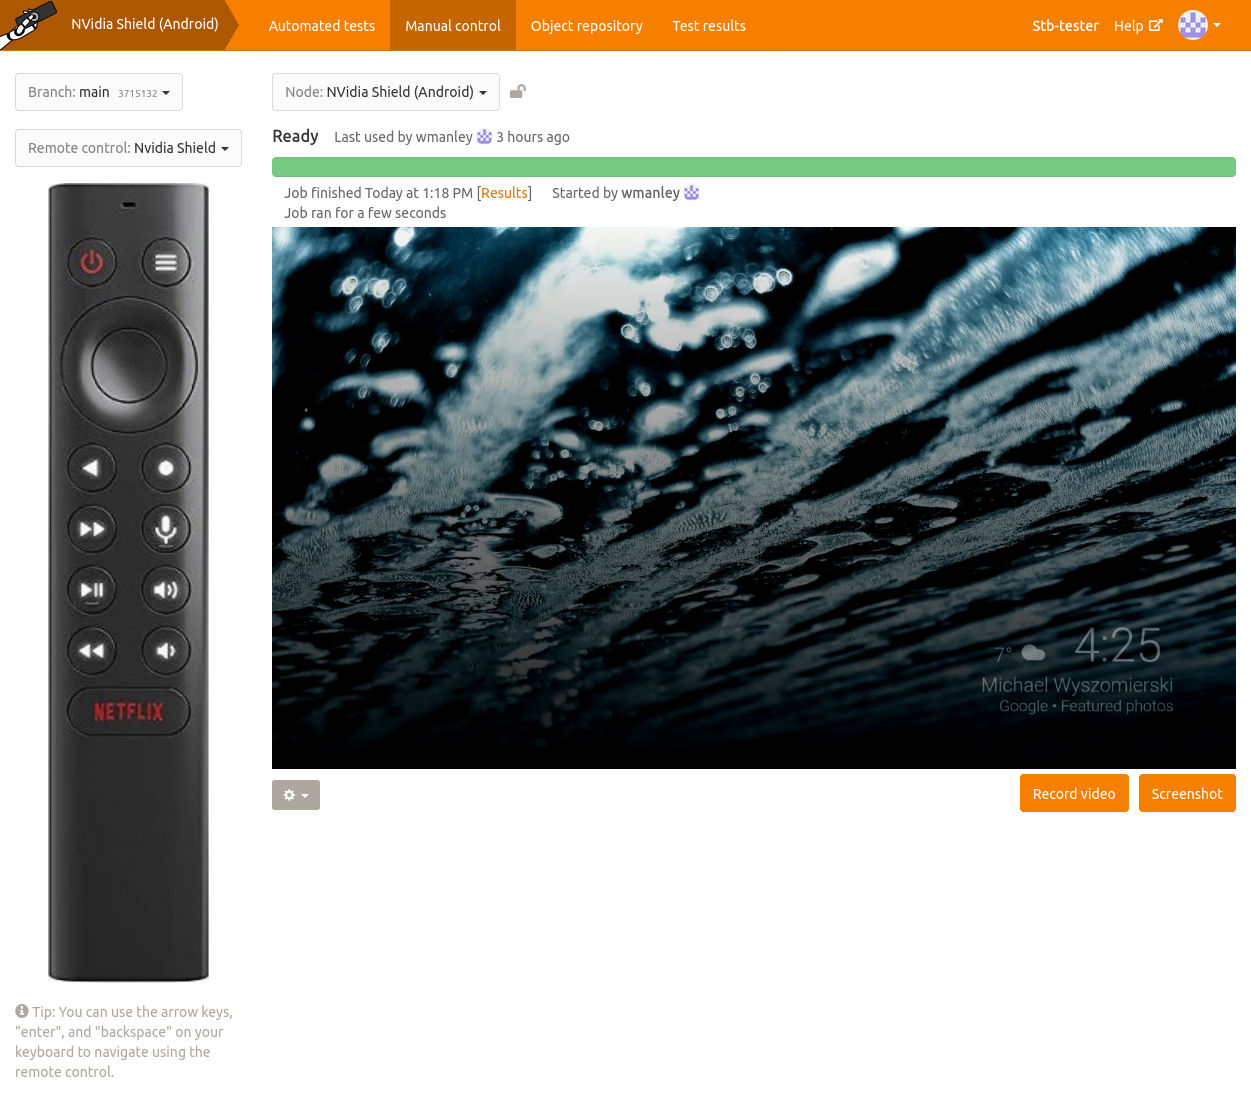
Record video#
Click the button to start recording a video of the device-under-test. Click the button again to stop recording. The video will be saved as a test result.
Stb-tester can be configured to save logs when recording a video. See Capturing logs from the device-under-test.
Test results#
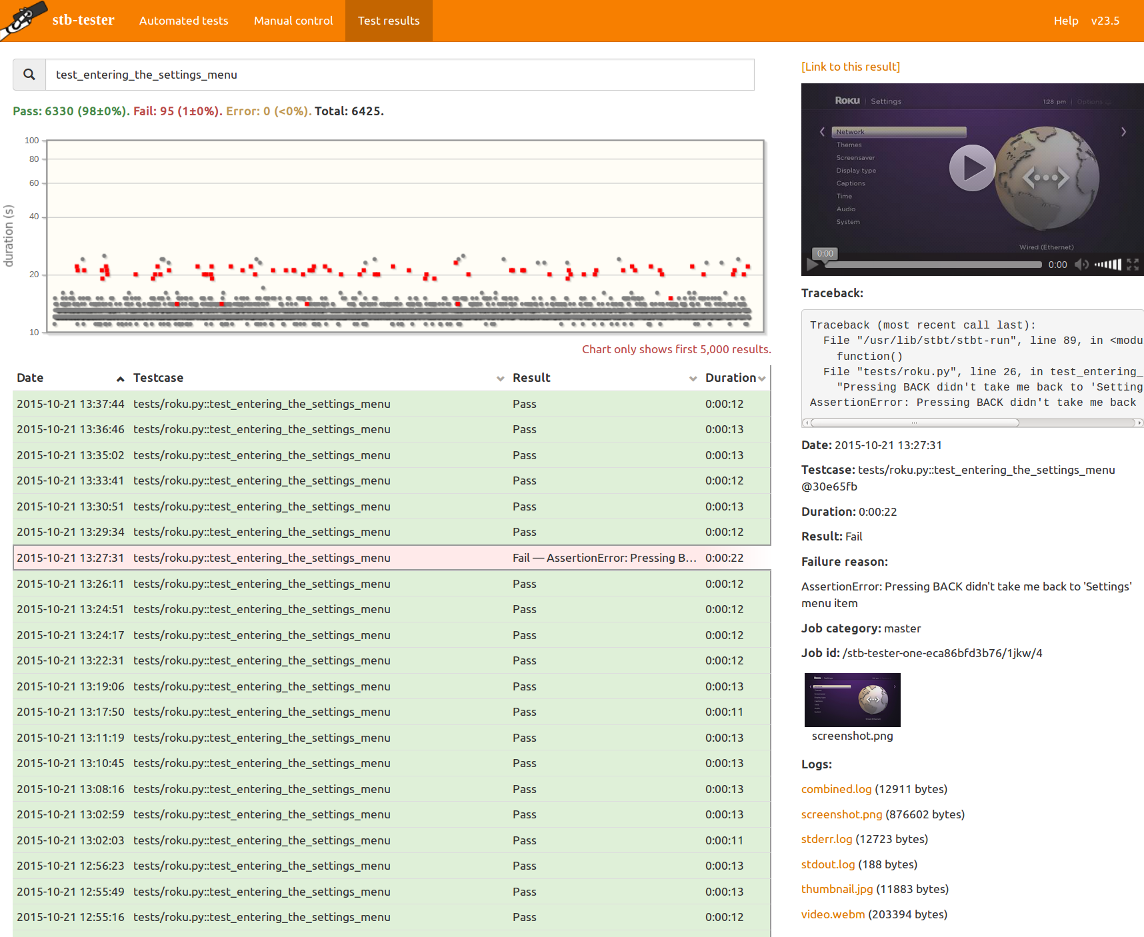
Filter#
The search box at the top of the page allows you to filter the results that are shown.
Usually you can just type the words that you want to match. This will show results that contain all of the words you typed (in any order). It will search in the testcase name, the result / failure reason, and the job category (a label that you specify when you run a test job). All searches are case insensitive.
Use quotes to search for a specific phrase with spaces: "app crashed" or 'app crashed'
Limit the search to specific fields: testcase:settings result:fail will show failing testruns from any testcases with the word “settings” in the testcase name. Note that these field names match the column headings of the results table.
branch: matches the git branch of the test-pack.
Note: For test jobs initiated via the REST API, the git branch is only recorded if it was specified by name, not by sha.
category: matches the job category (a label that you specify when you run a test job).
date: matches the start timestamp of a testrun.
date:>"2015-10-21 13:27:00" shows testruns that started after the specified time.
date:>2015-10-21 – if you leave out the time, it defaults to midnight (the start of the day). Similarly, you can leave out the seconds, or the minutes.
date:<"2015-10-21 13:27:00" shows testruns that started before the specified time.
date:[2015-10-21 13:00 to 2015-10-21 06:30] shows testruns that started within the specified range – from 13:00:00 to 06:30:59.
date:>now-1d shows testruns that started within the last day (the current time minus 24 hours). The following units are understood:
seconds, second, sec, s
minutes, minute, min, m
hours, hour, hr, h
days, day, d
weeks, week, w
months, month, M
The time units can be combined, for example “2hr30min”.
duration: matches how long a testrun took.
This duration can be specified with units, for example duration:>2hr30min. If no units are specified it is assumed to be in seconds. See the date syntax above for the supported units.
You can use ranges with square brackets, similar to the date syntax above.
job: matches the specified job, for example job:/stb-tester-abcdef123456/0000/4. You can find the job uid in the result details pane on the right, or via the REST API.
node: matches tests than ran on a specific Stb-tester Node, for example node:stb-tester-abcdef123456.
result: matches the result or failure reason.
result:pass shows passing results.
result:fail shows failing results.
result:error shows errored results (for example, the test did not complete because of a bug in the test script).
result:"some failure reason" shows failing or errored results with the specified failure reason (that is, the text of the exception raised by your test script).
sha: matches the git sha of the test-pack.
tag: matches a tag name, and optionally a value. For example tag:sanity matches any result that had the tag “sanity” specified when the test was run, and tag:model=T-1000 matches the tag “model” only if it has the value “T-1000”. See Tags.
testcase: matches the testcase name.
user: matches the username of the person who started the test job.
Combine search terms with boolean operators (and, or, not). A space is the same as and (unless inside quotes).
testcase:settings and result:pass shows results from testcases with the word “settings” in their name, that passed.
testcase:settings result:pass is the same as the previous example.
testcase:settings or result:pass shows all results that passed, as well as all results for testcases with the word “settings” in their name.
(testcase:settings or testcase:menu) result:pass – use parentheses for precedence in complex boolean queries. Without parentheses, and has higher precedence than or.
REST API#
The Stb-tester Portal provides a REST API for accessing test results programmatically.
Further reading#
Stb-tester’s test-results interface is designed to streamline the “triage” process of checking test failures. For a detailed guide see Investigating intermittent bugs.
Stb-tester records a video of each test-run, with frame-accurate synchronisation between the video and the logs from your test script. See Interactive log viewer.
Save screenshot to Object Repository#
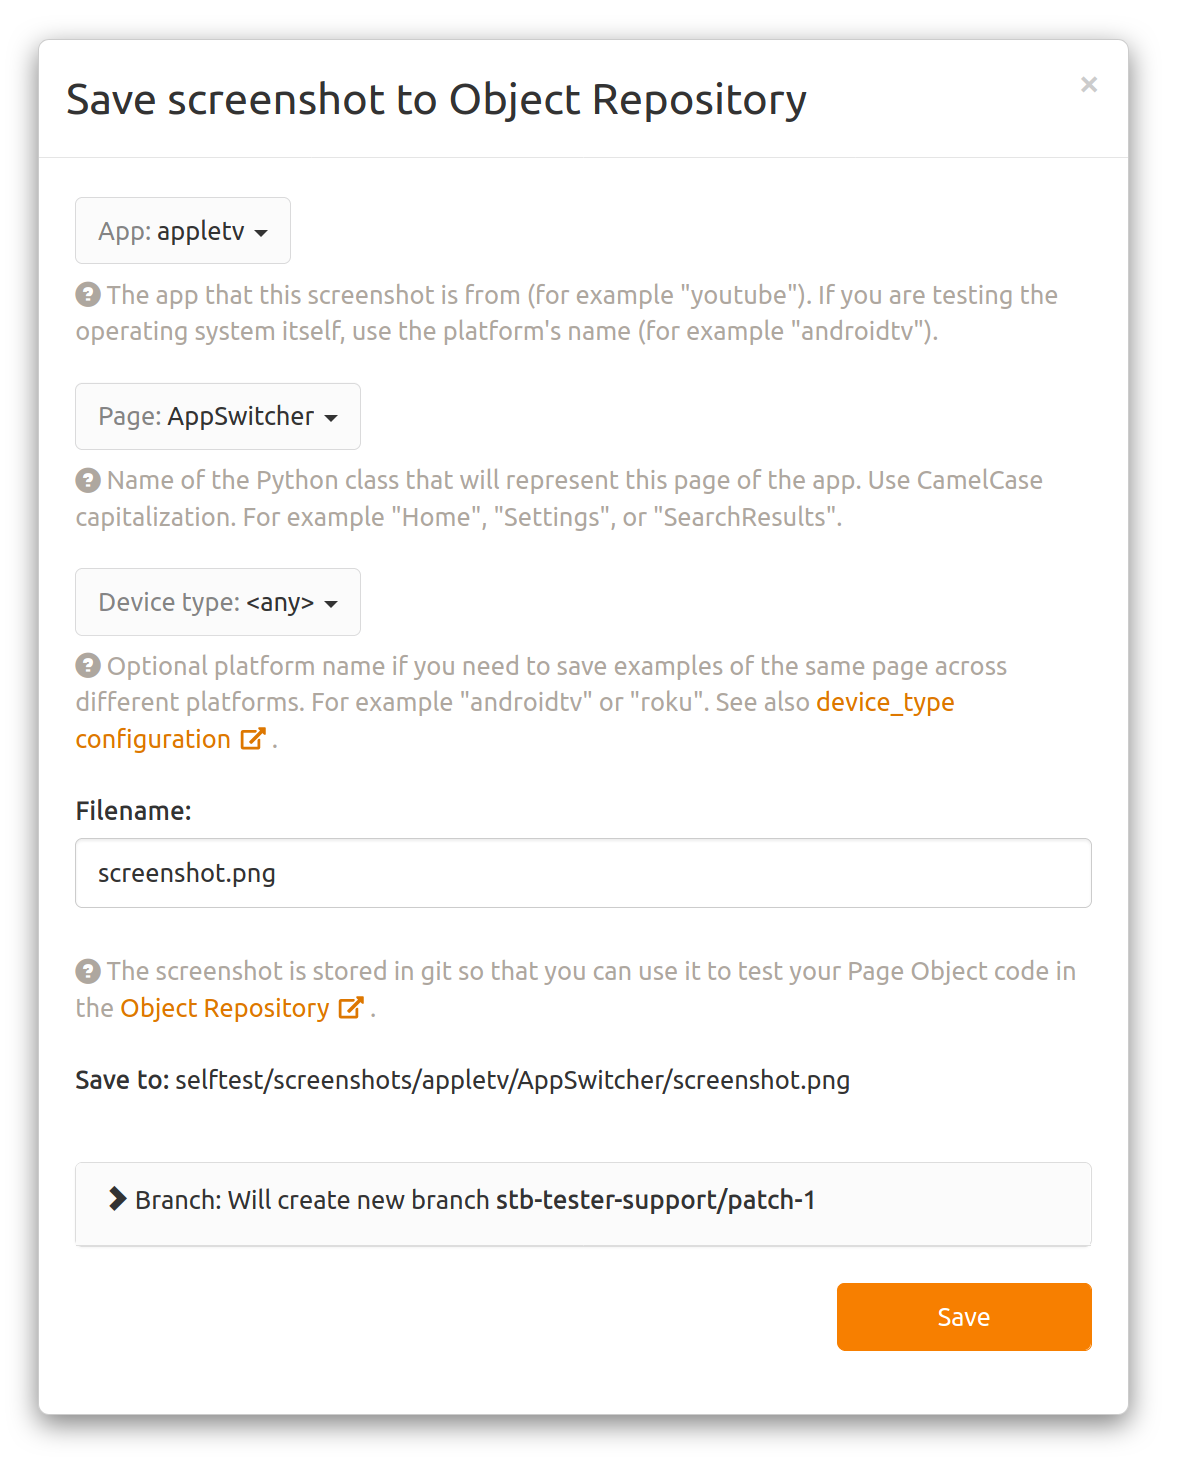
App: The app that this screenshot is from (for example “youtube”). If you are testing the operating system itself, use the platform’s name (for example “androidtv”).
Page: Name of the Python class that will represent this page of the app. Use CamelCase capitalization. For example “Home”, “Settings”, or “SearchResults”.
Save to: This previews the filename that the screenshot will be saved as. It’s determined by what you enter in App, Page and Filename. Learn more about the test-pack file layout here.
Branch: The screenshot is saved to your test-pack by creating a new commit in your test-pack git repository. This controls which branch the commit will be created on.